projects
List of projects.
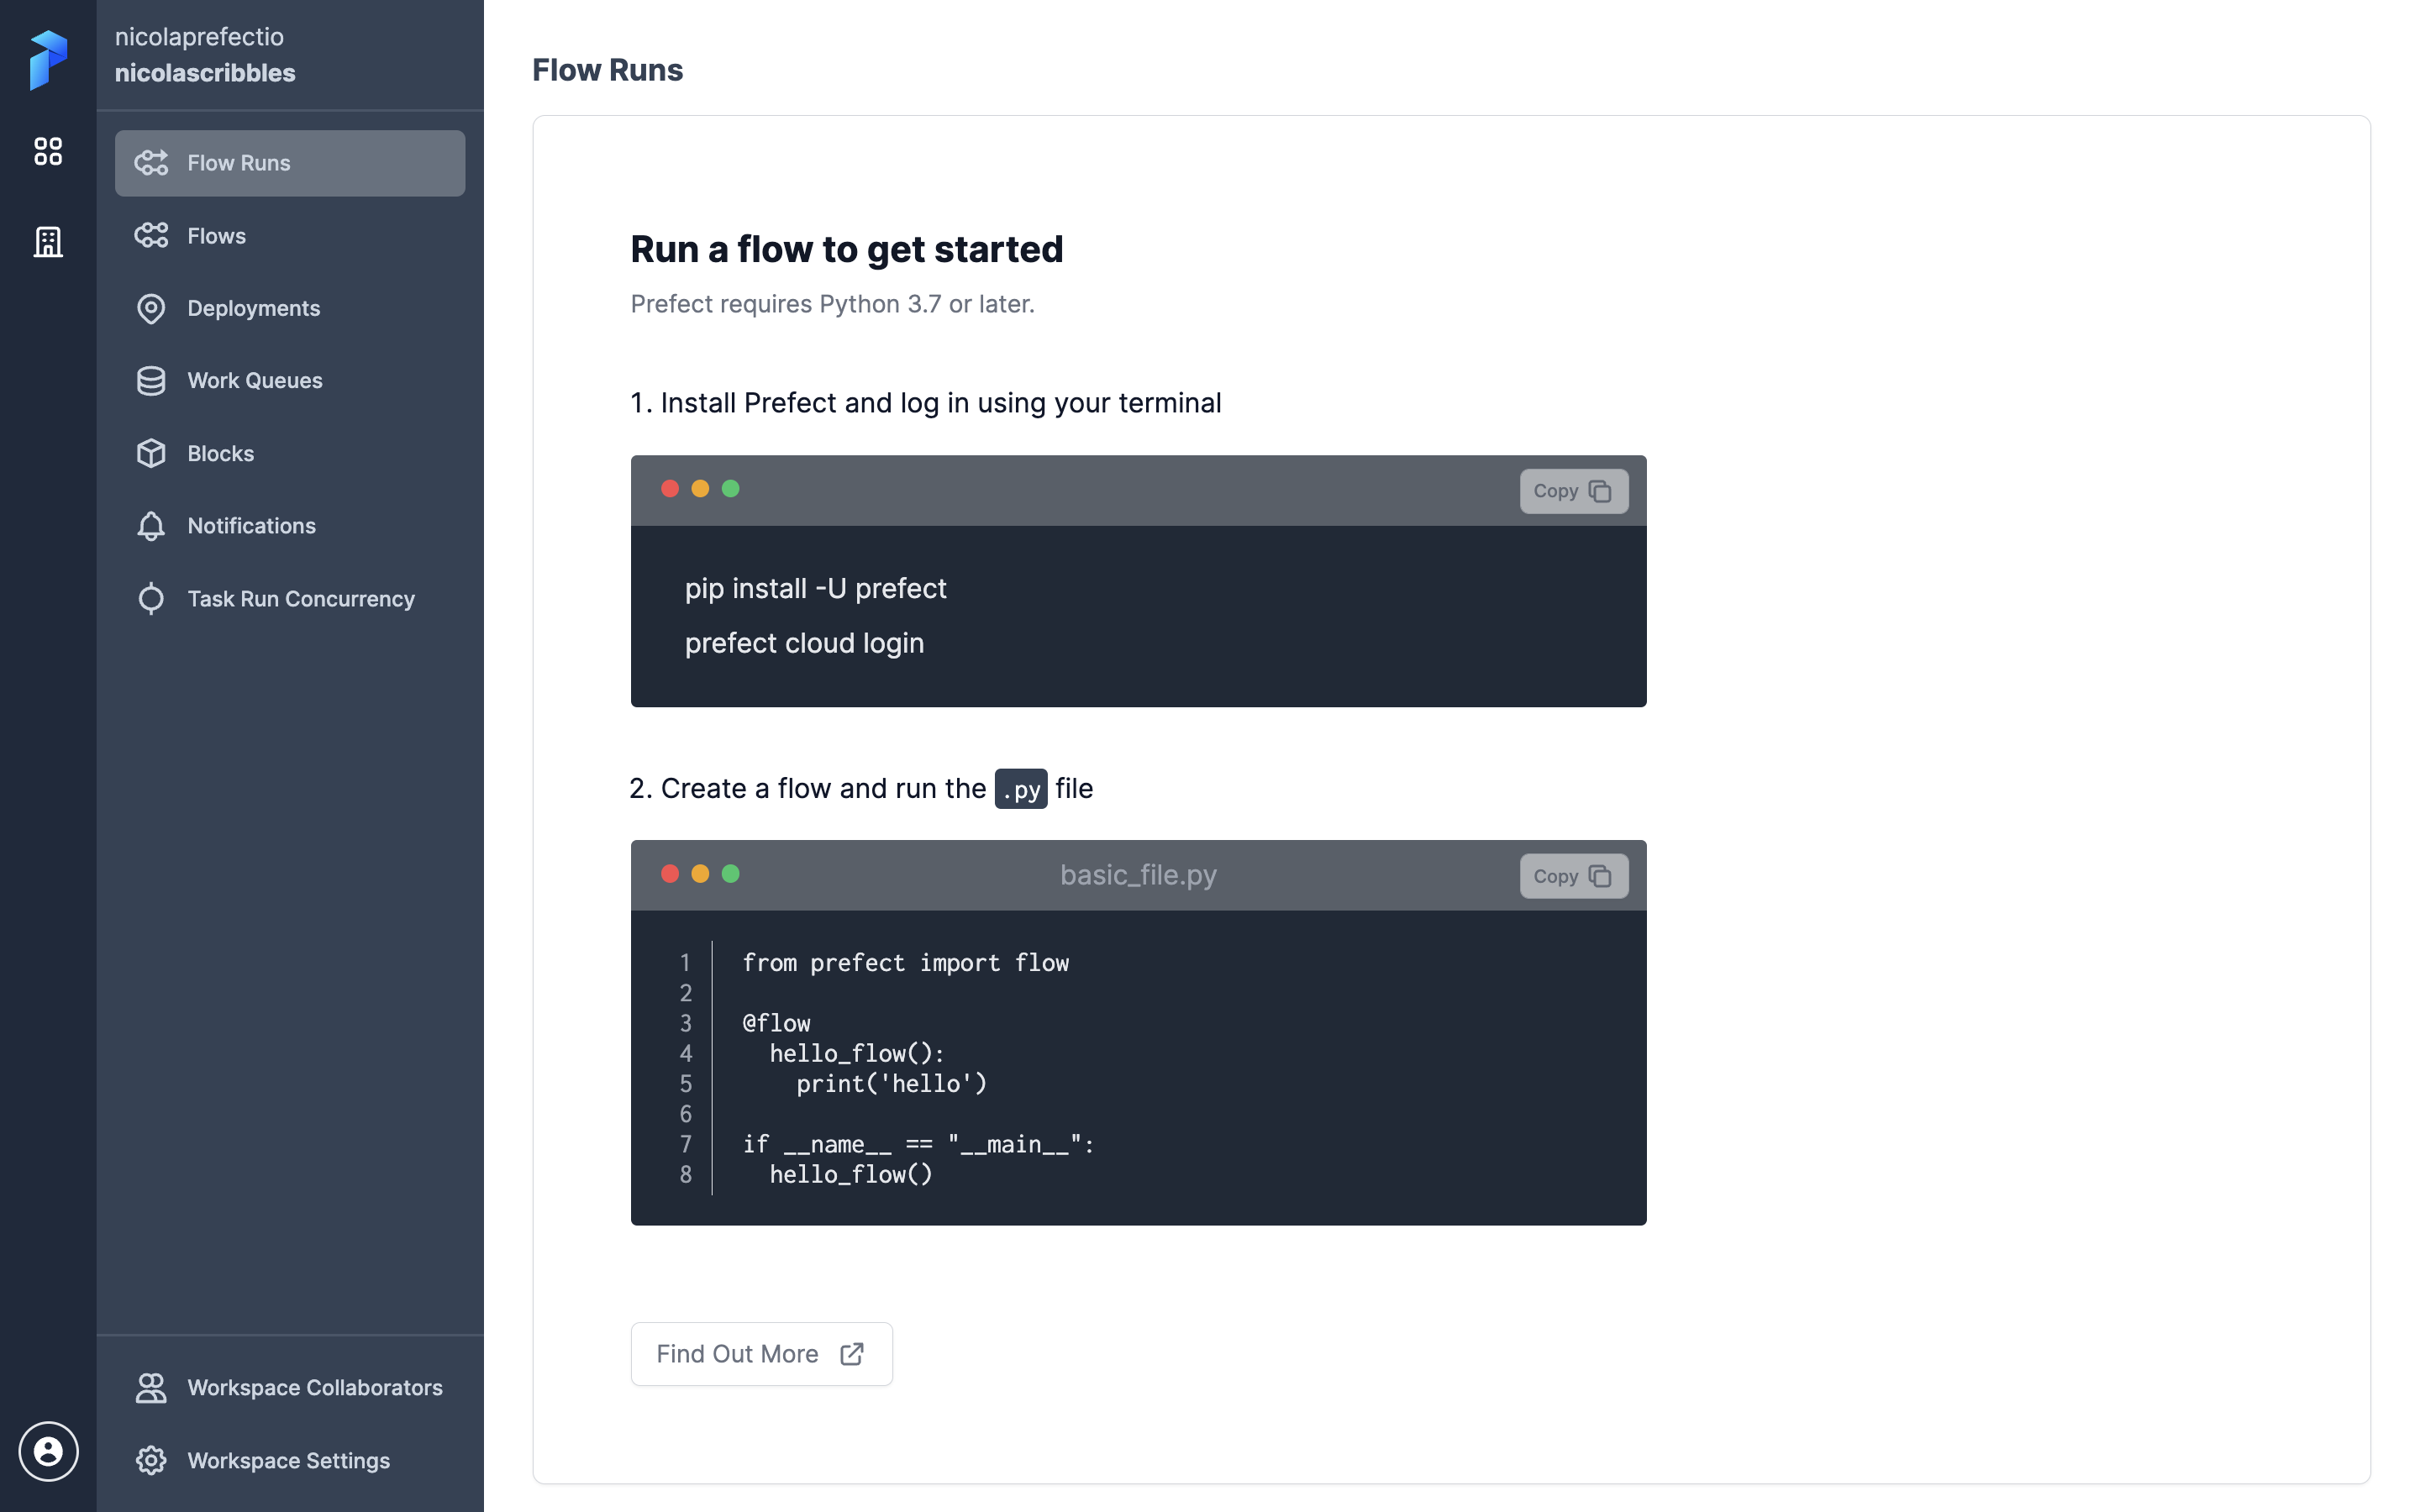
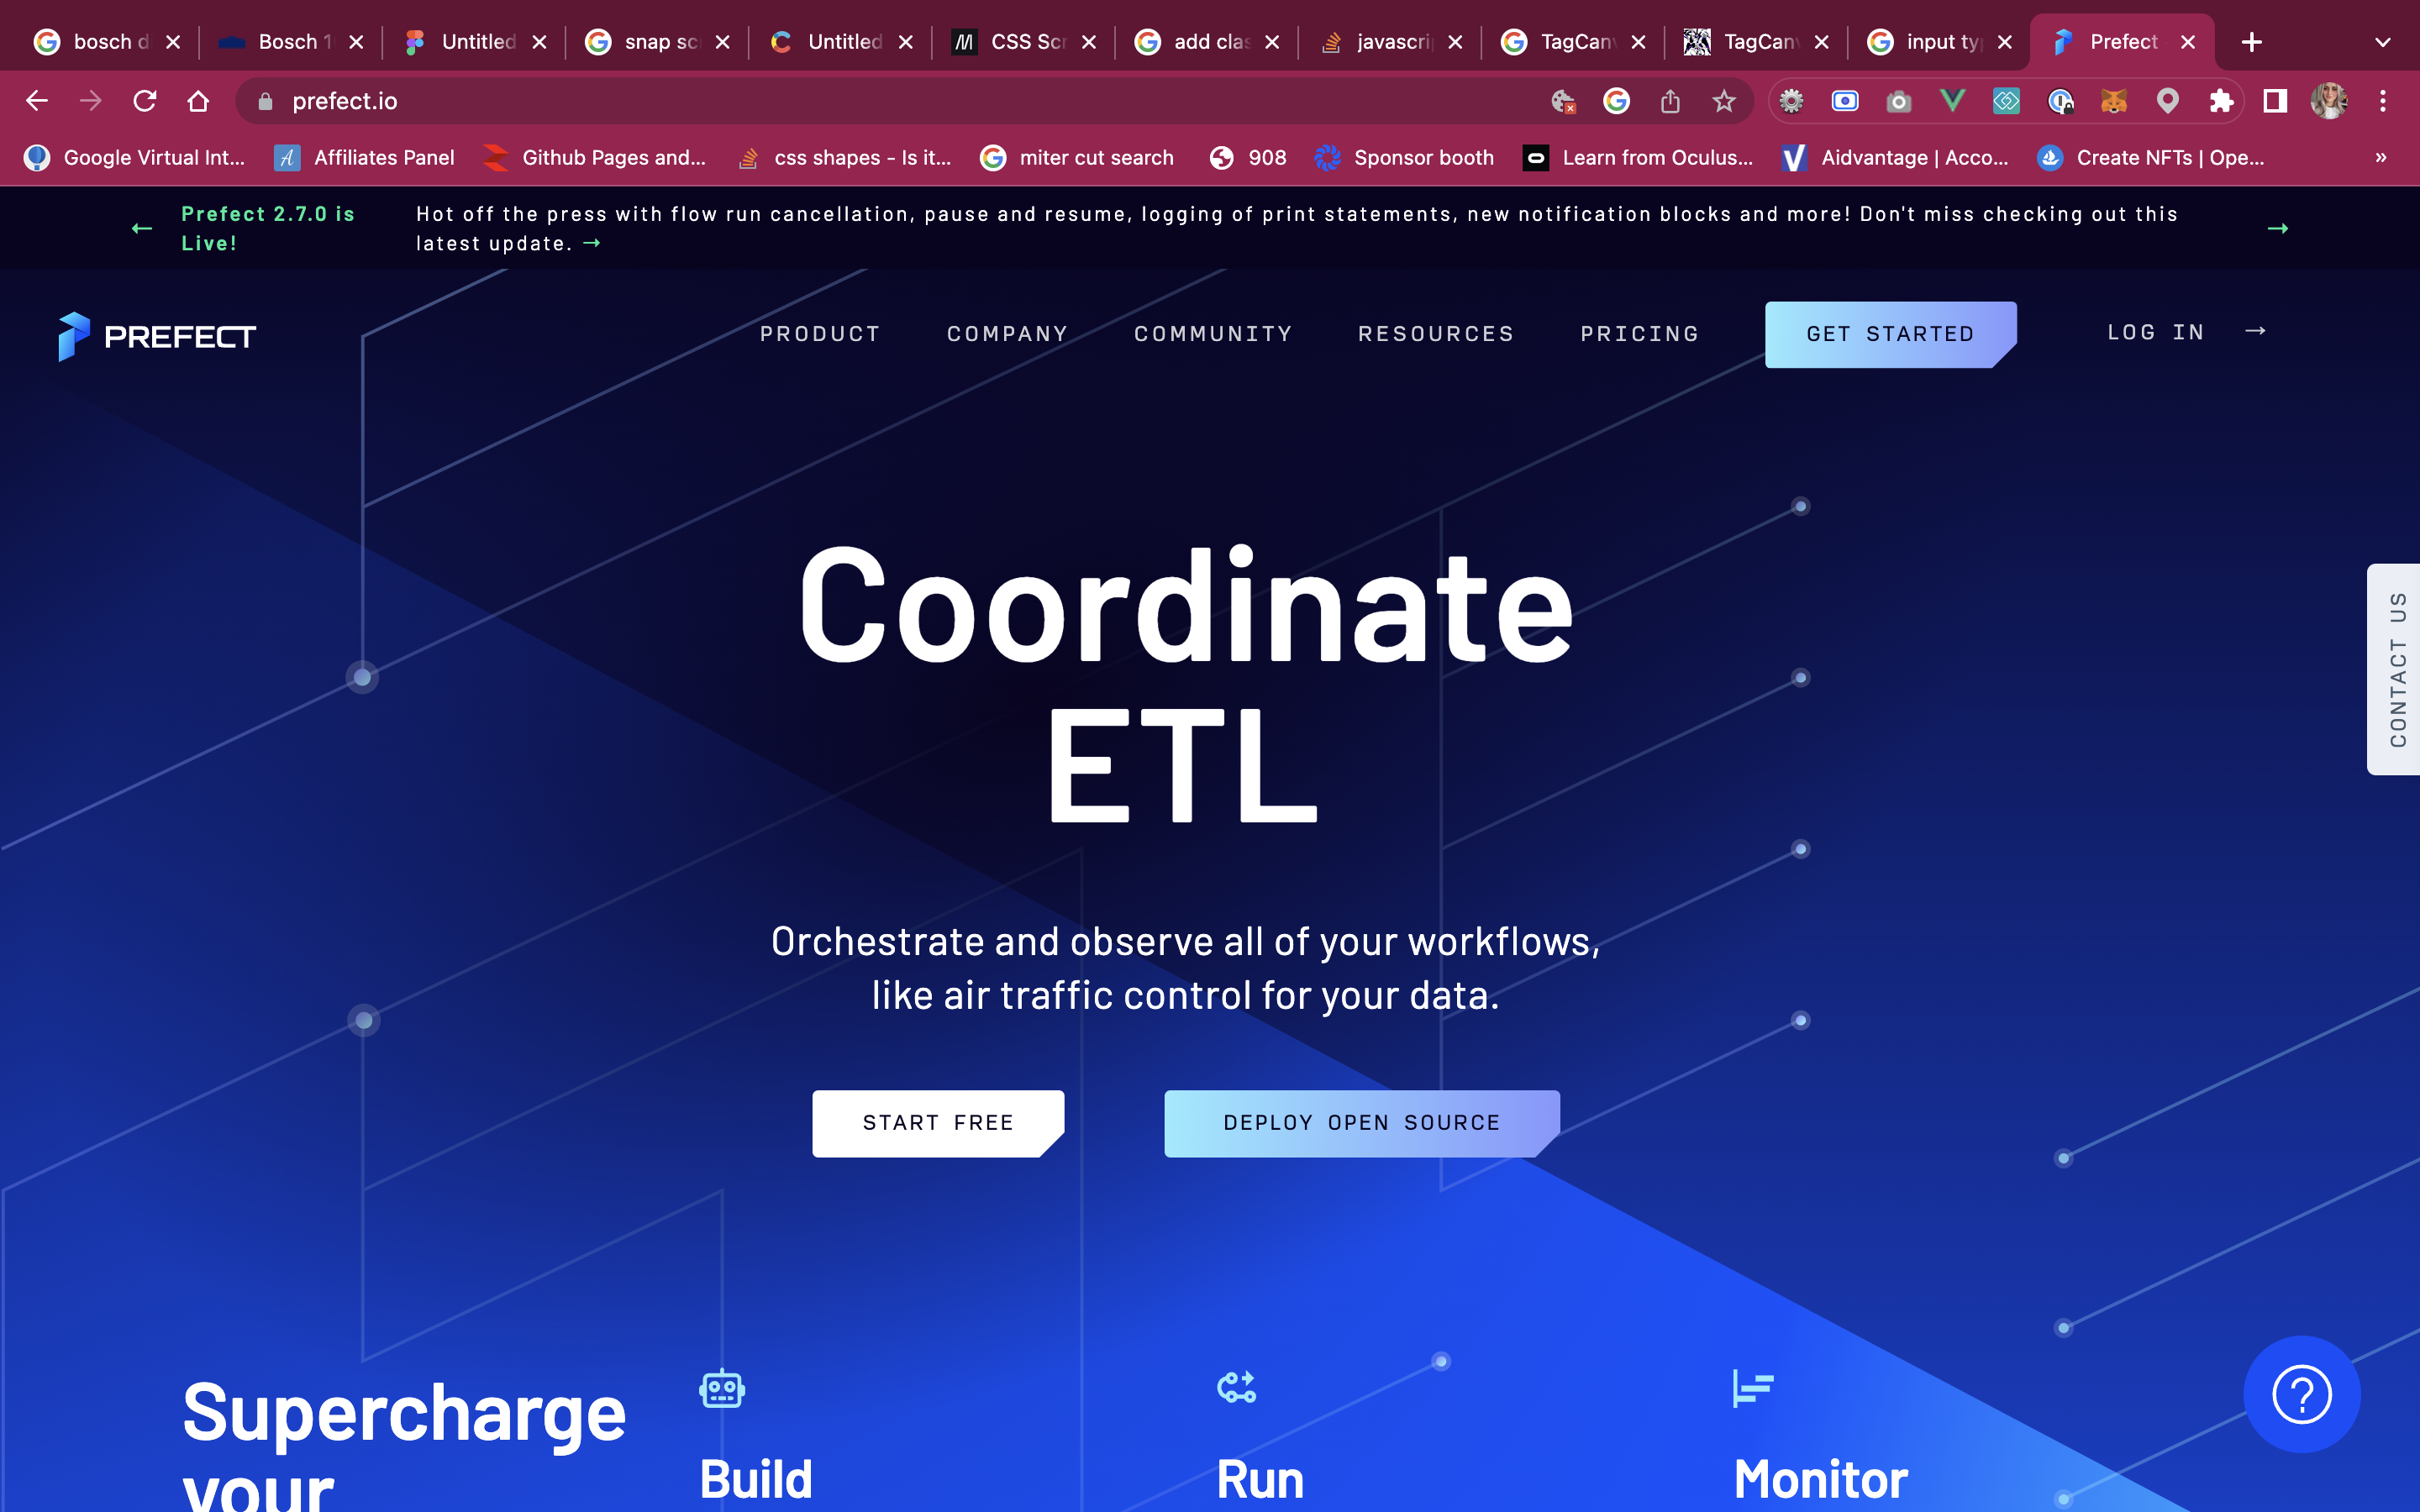
vuejsjavascriptpythonnuxt3AI
VueJSSCSSNPMMono Repository

GridsomeVue.jsContentfulTailwindcss
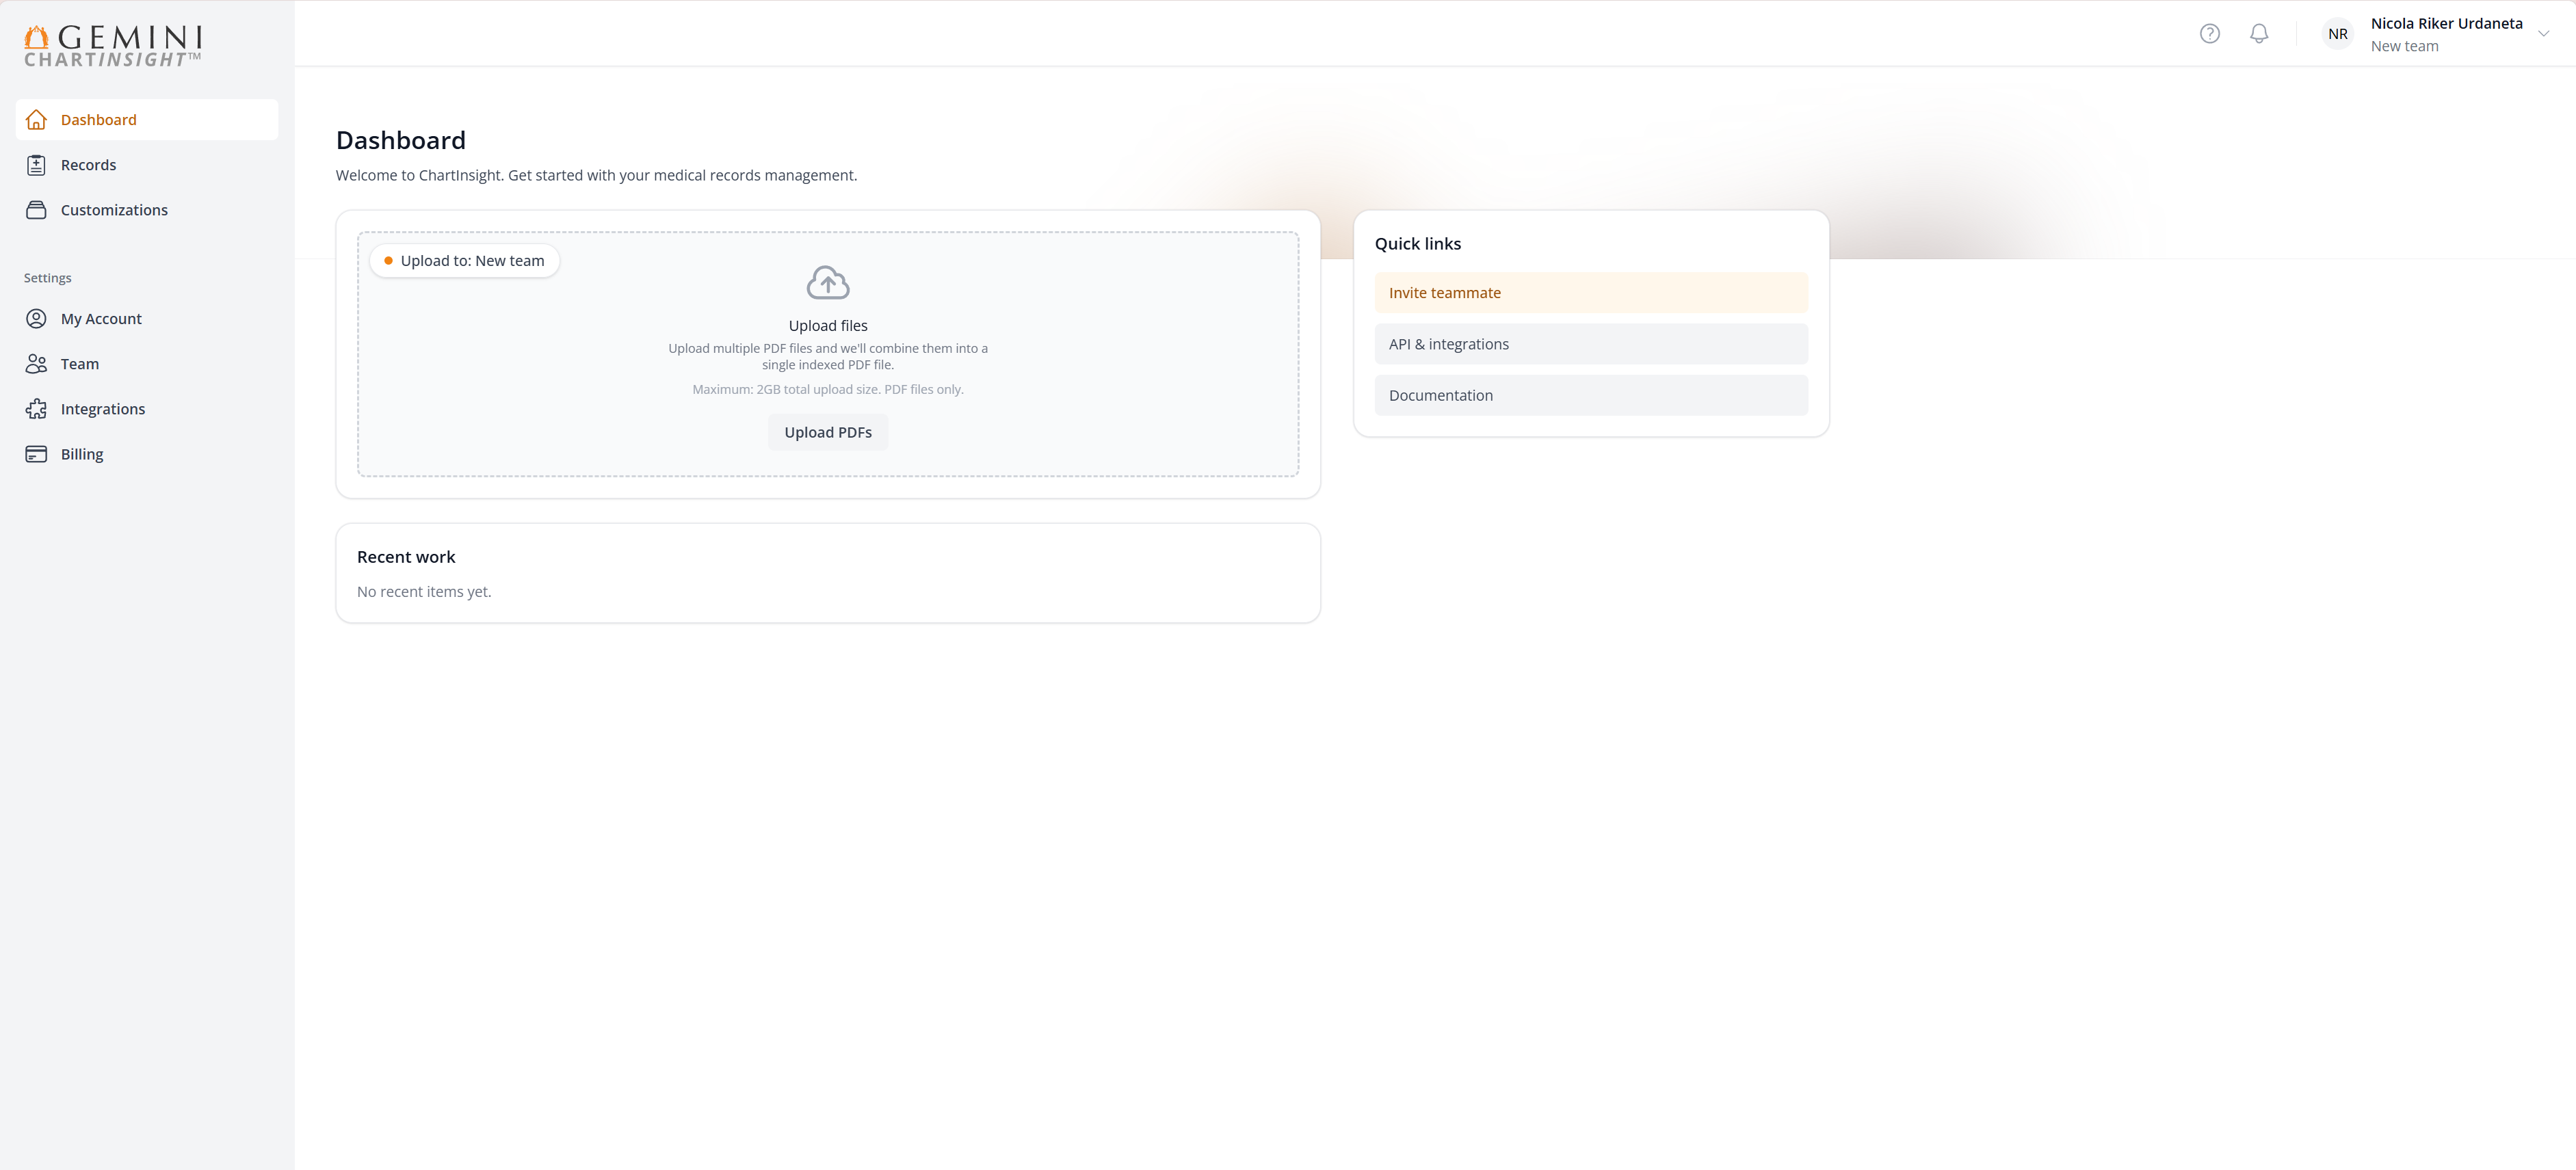
My Portfolio
I started this portfolio to showcase my wins and projects.
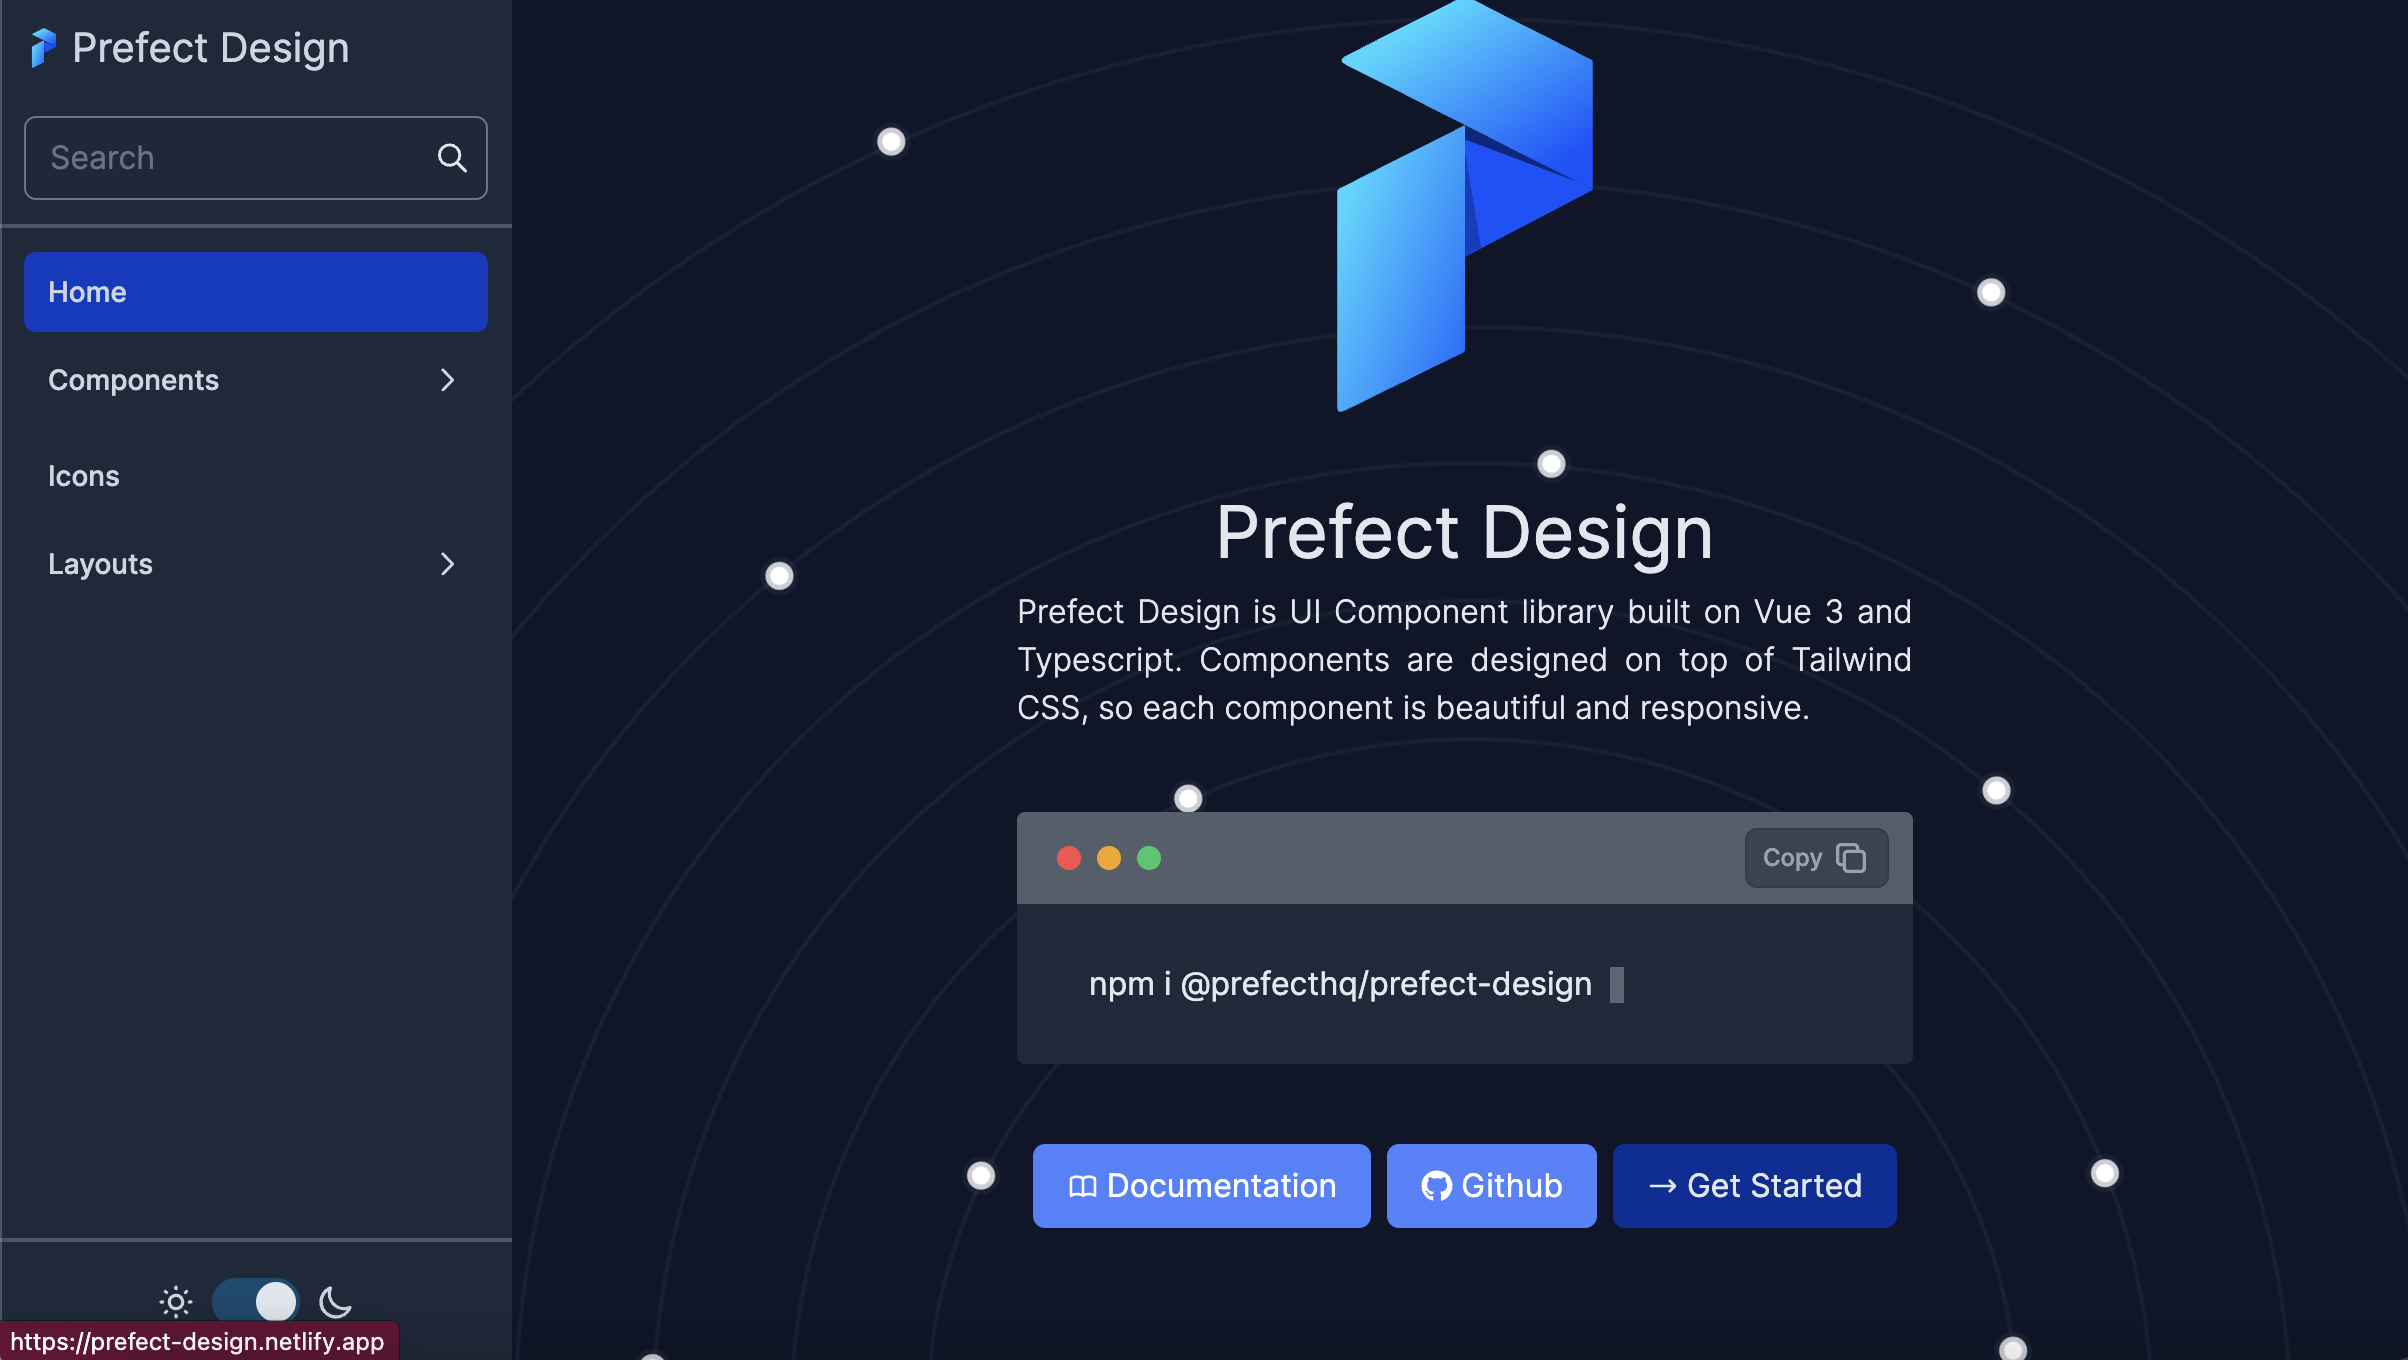
Vue 3 Composition APITypescriptTailwindCSSOSS
TypescriptVue 3 Composition API
Vue.jsGridsomeTailwindcssContentful

HTMLCSSJSPHP
AdPro 360° Results
My work here is still being used, despite some changes being made overtime. This proves that the work I produce is a worthwhile investment you will use for years to come.
small-projects
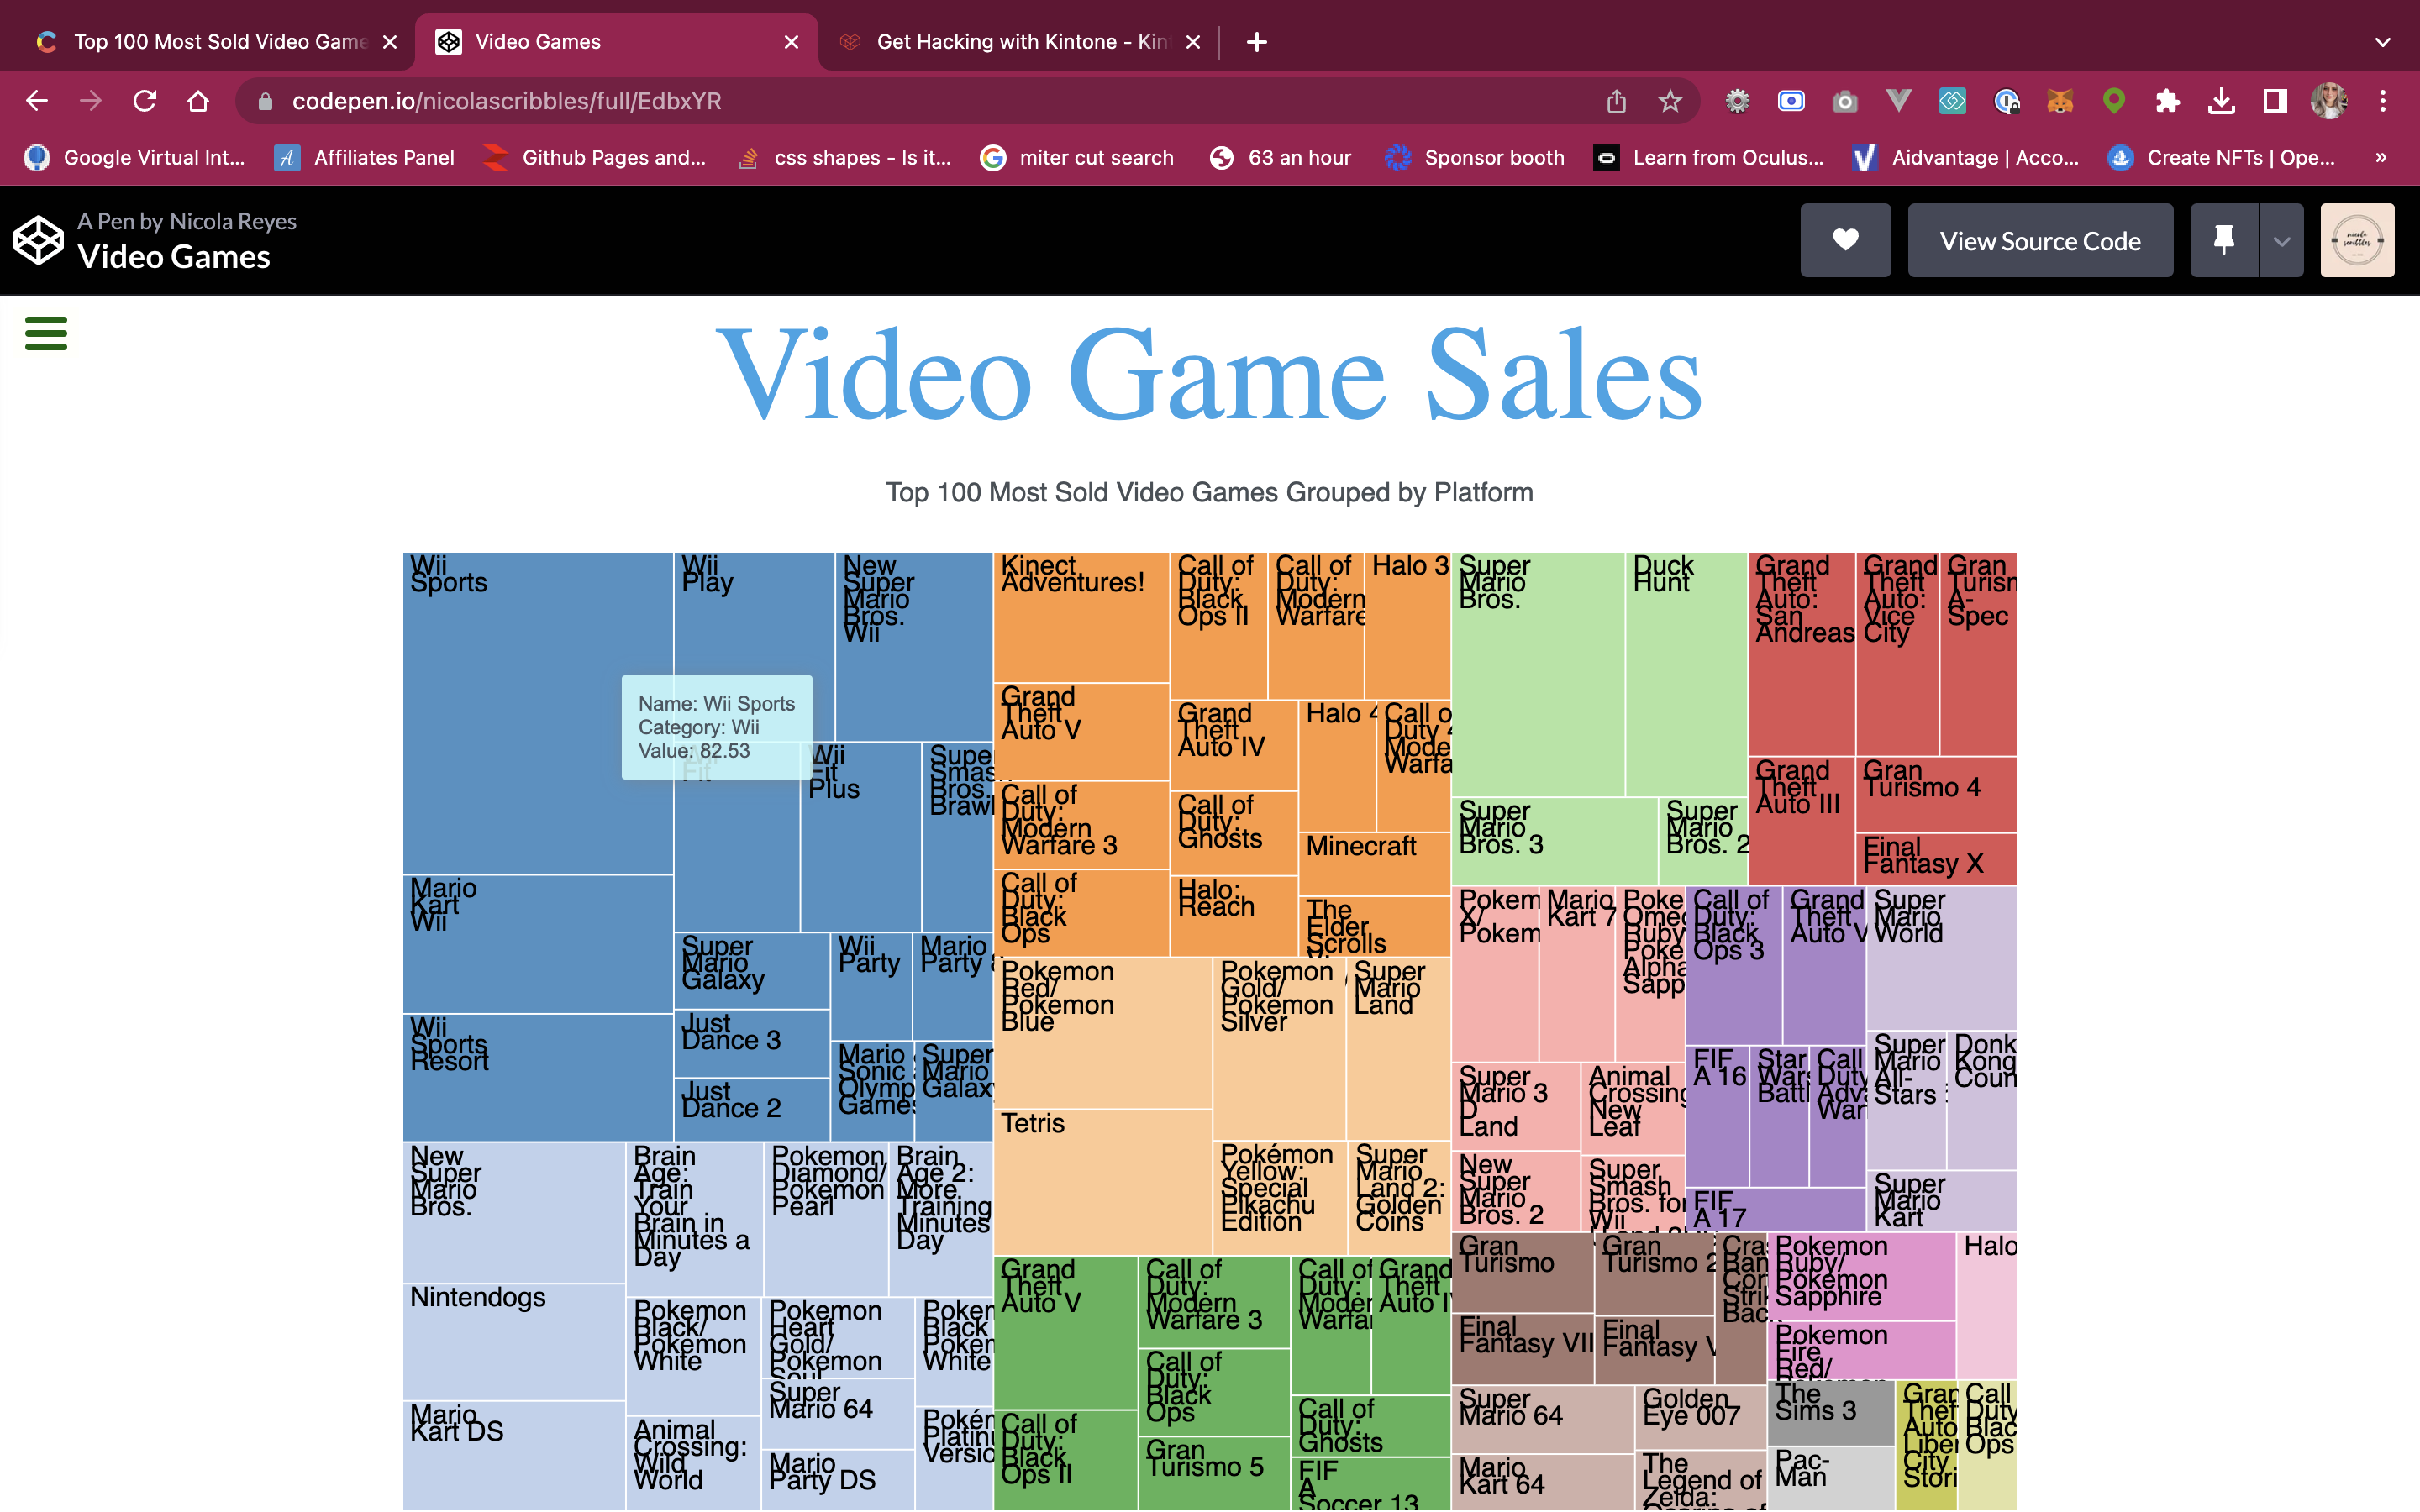
D3.jsTree MapData Visualization

GSAPThree.jsNuxt.jsVue.jsTailwind CSS

d3.jschoropleth
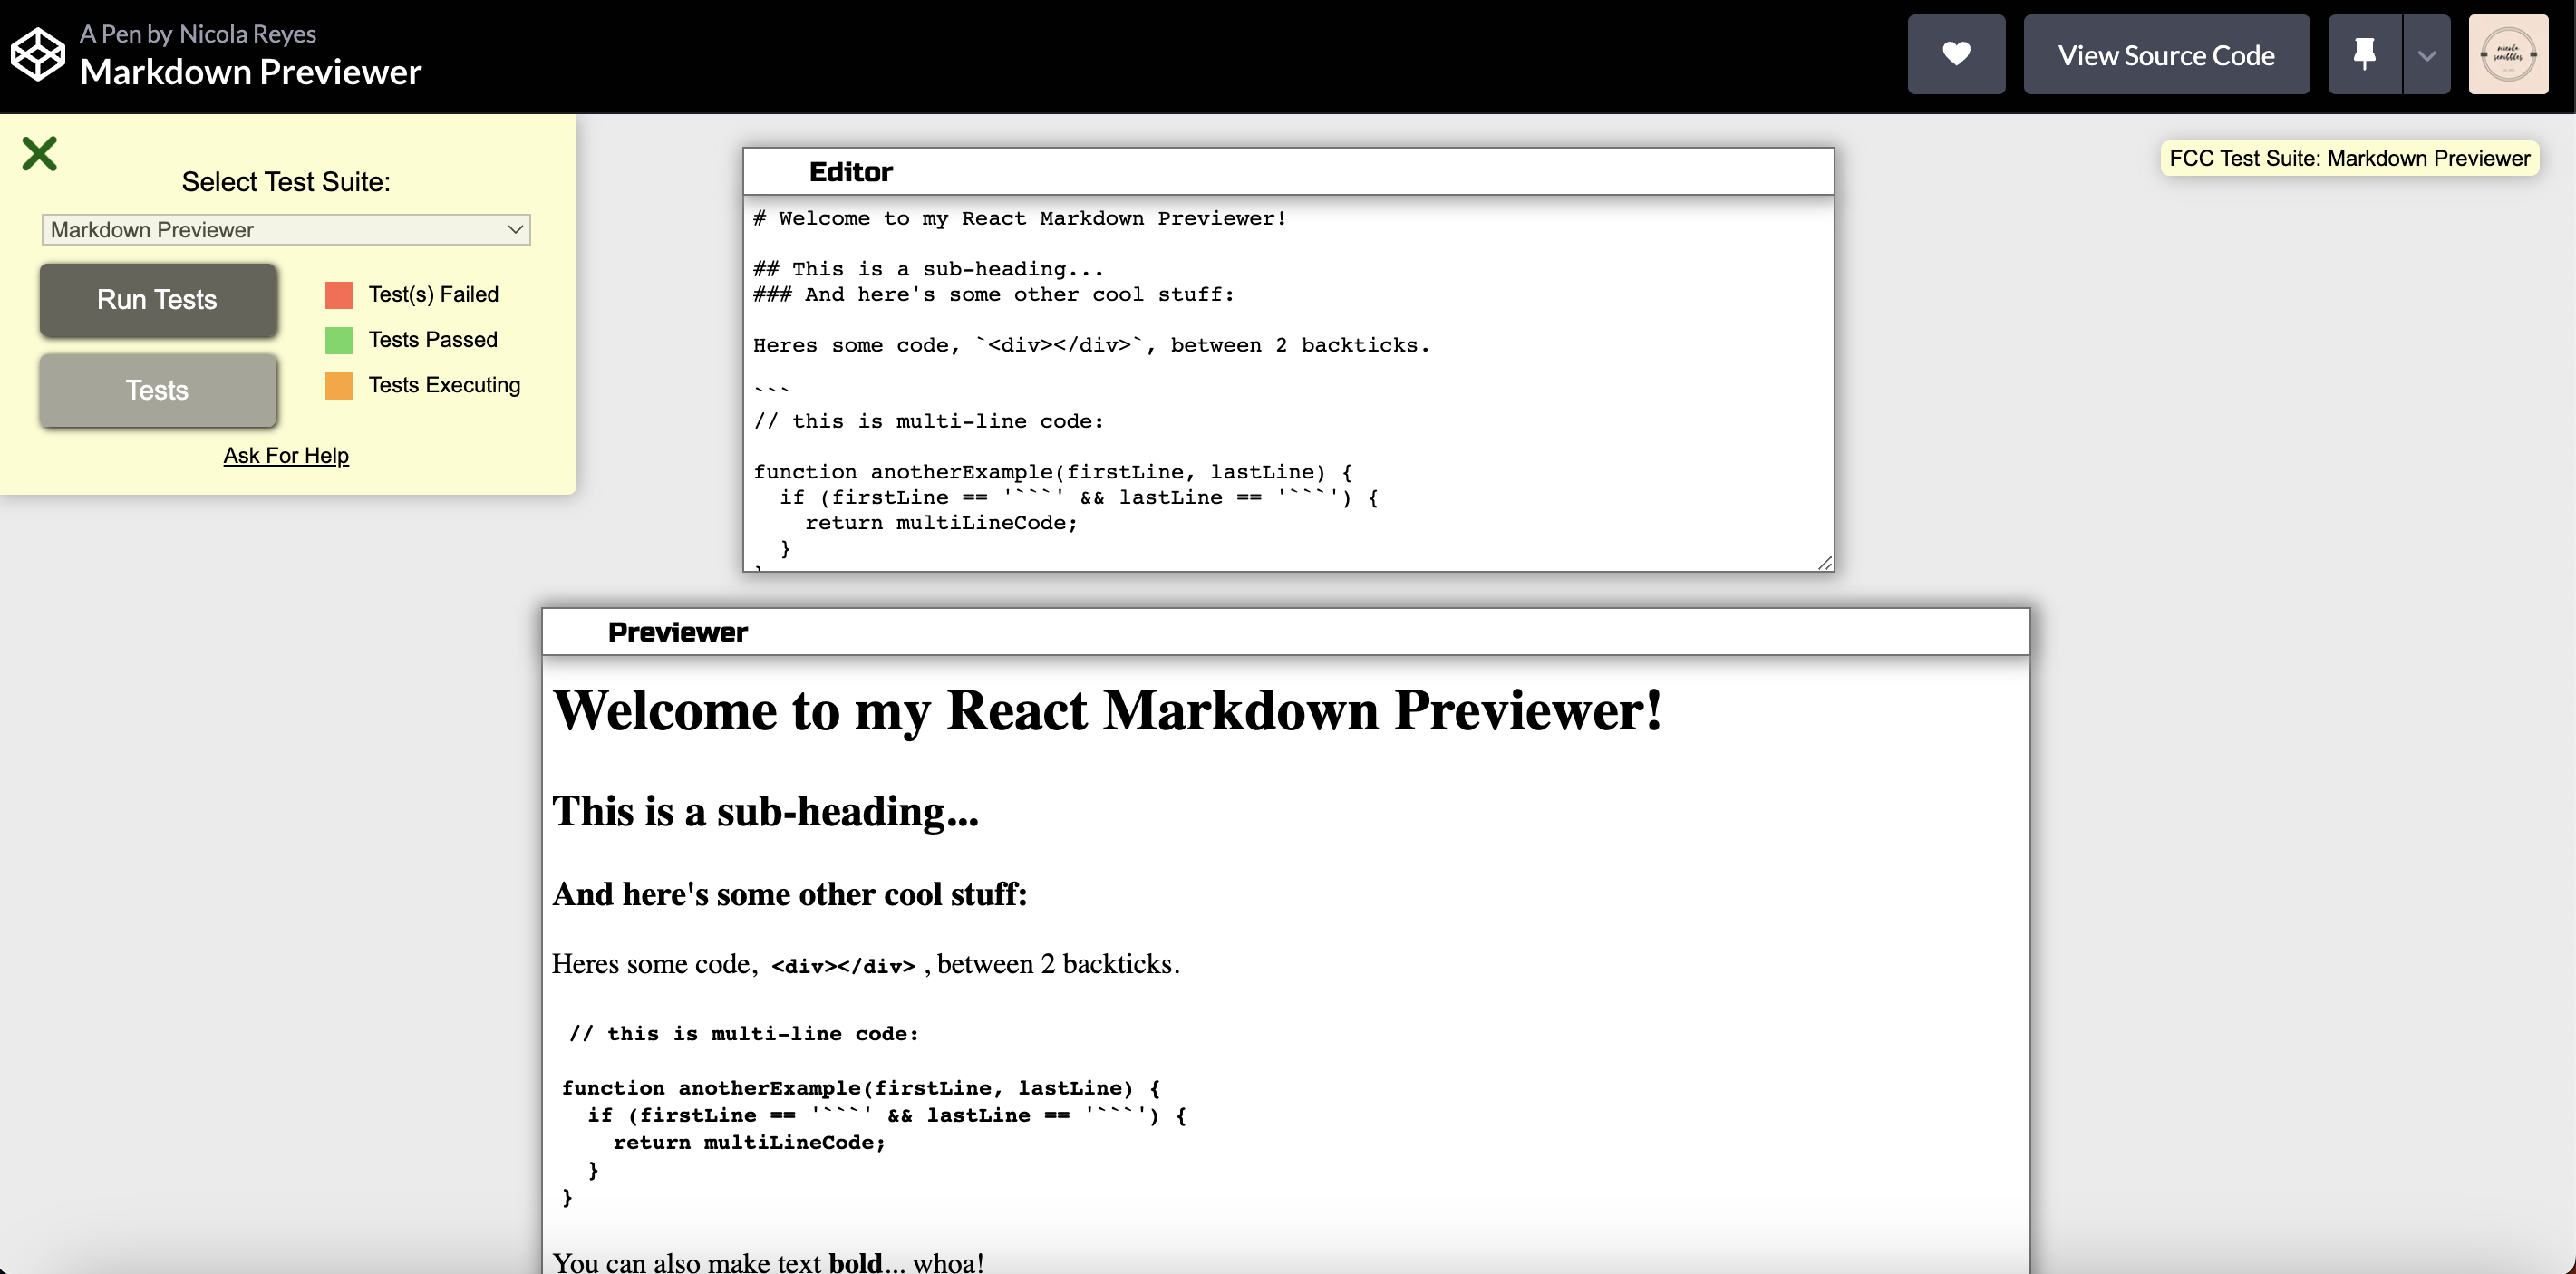
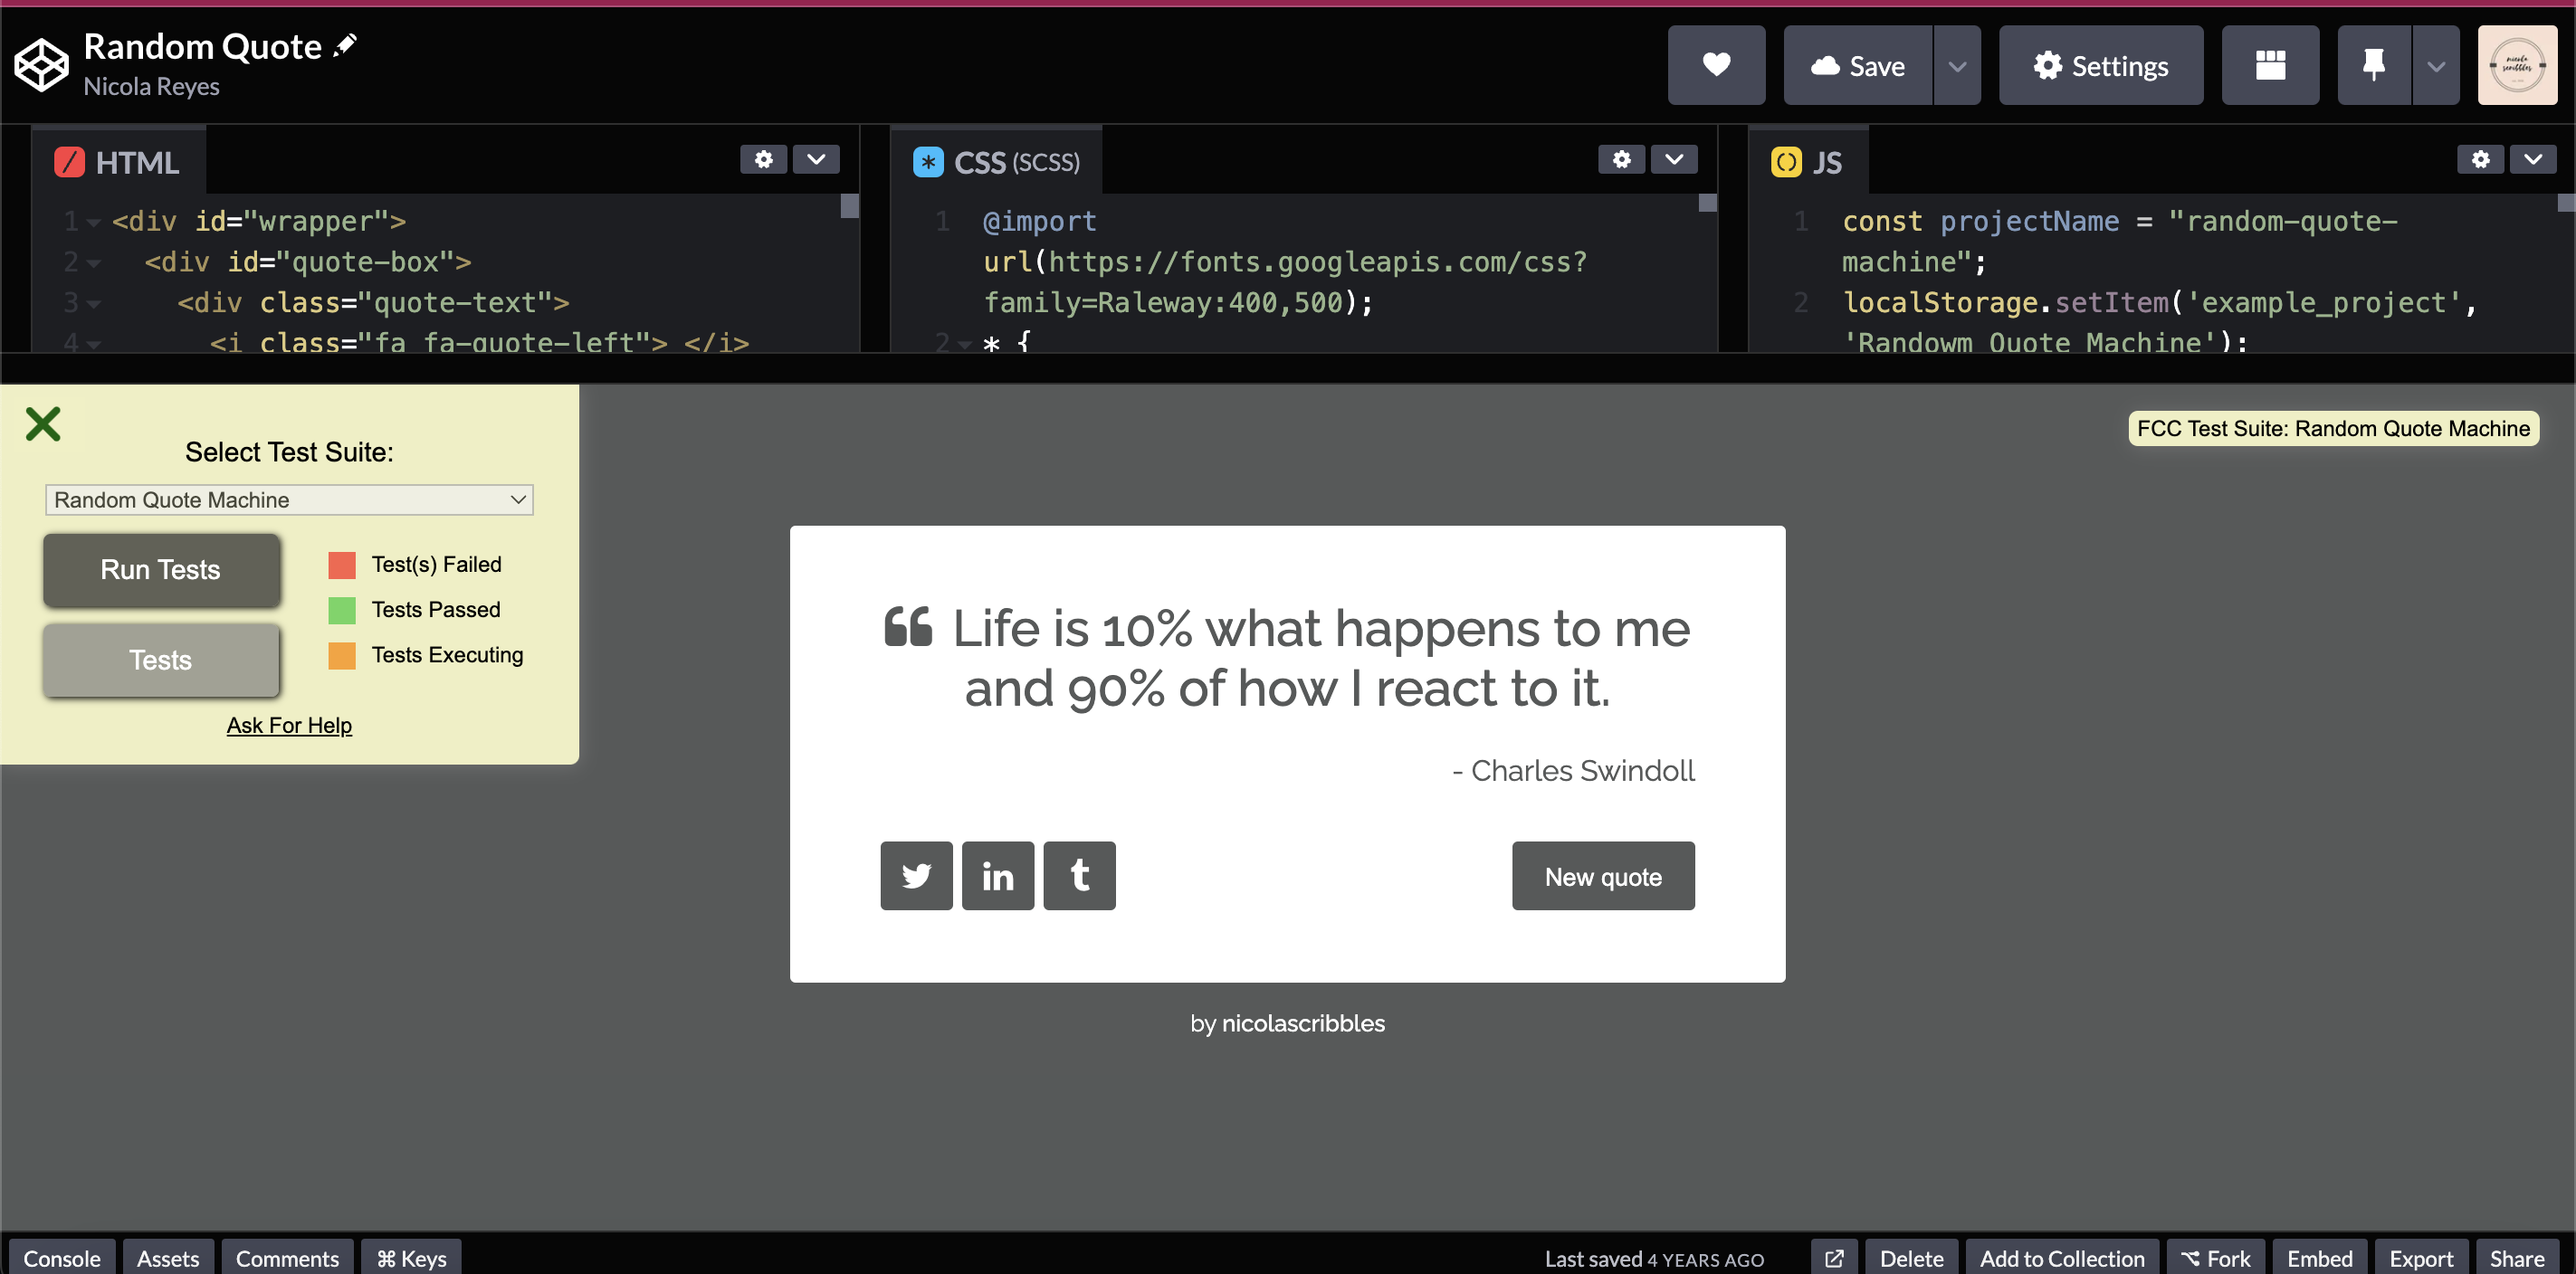
HAMLSCSSReact.jsBabel
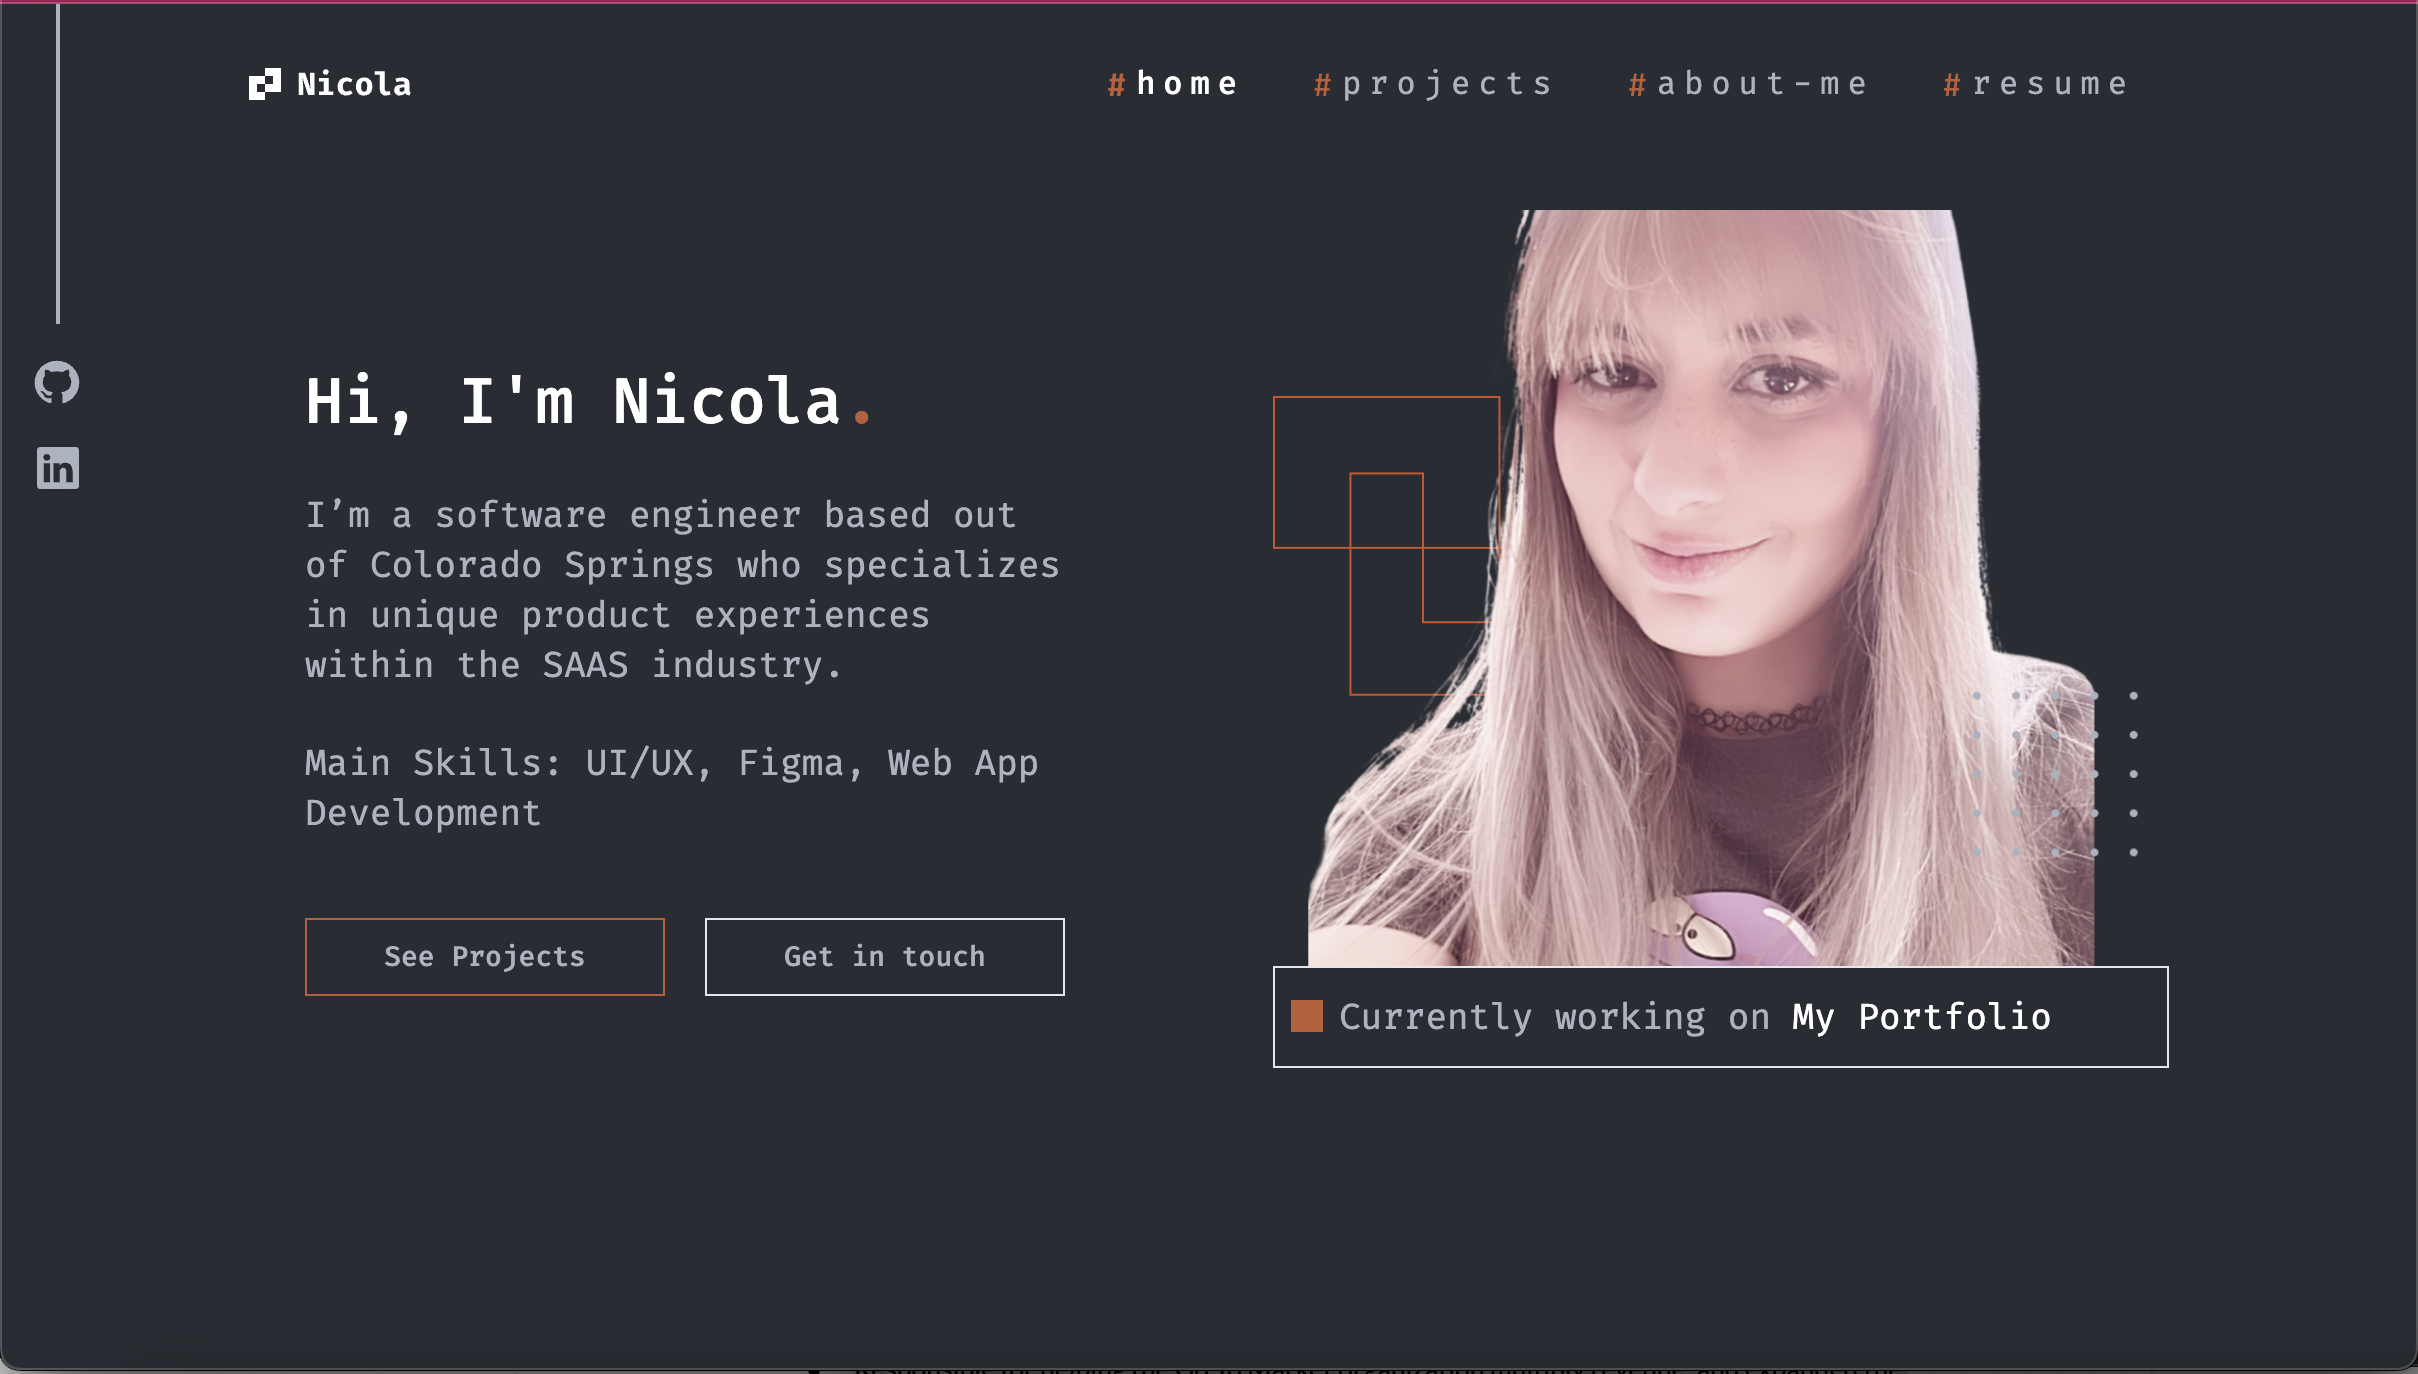
Front End Software Engineer and Web Designer
Web Application Development and User Experience Expert
© Copyright 2026.